C/2020 H6 ATLAS
more info
Comet C/2020 H6 was discovered on 22 April 2020, about 1.3 yr before its perihelion passage. This comet was observed until 8 January 2024 (as in February 2025).
Comet had its closest approach to the Earth on 30 April 2021 (3.86 au); about six months before its perihelion passage.
The preferred NG solution ('bd') given here is based on data span over 3.72 yr in a range of heliocentric distances: 6.22 au – 4.70 au (perihelion) – 7.80 au. Orbits based on pre-perihelion and post-perihelion data independently are also presented.
This Oort spike comet suffers moderate planetary perturbations during its passage through the planetary system that lead to a significantly more tight future orbit (semimajor axis of about 2,000 au).
| solution description | ||
|---|---|---|
| number of observations | 792 | |
| data interval | 2020 04 22 – 2021 08 23 | |
| data arc selection | data generally limited to pre-perihelion (PRE) | |
| range of heliocentric distances | 6.22 au – 4.71au | |
| type of model of motion | NC - non-gravitational orbits for symmetric CO-g(r)-like function | |
| data weighting | YES | |
| number of residuals | 1561 | |
| RMS [arcseconds] | 0.32 | |
| orbit quality class | 1a | |
| previous orbit statistics, both Galactic and stellar perturbations were taken into account | ||
|---|---|---|
| no. of returning VCs in the swarm | 0 | |
| no. of escaping VCs in the swarm | 5002 | |
| no. of hyperbolas among escaping VCs in the swarm | 4553 | * |
| previous reciprocal semi-major axis [10-6 au-1] | -12.78 – -6.34 – -0.25 | |
| previous perihelion distance [au] | 24 – 27 – 31 | |
| previous aphelion distance [103 au] | 390 – 1200 – 7900 | |
| time interval to previous perihelion [Myr] | 2.36 ± 11.422 | |
| percentage of VCs with qprev > 20 | 100 | |
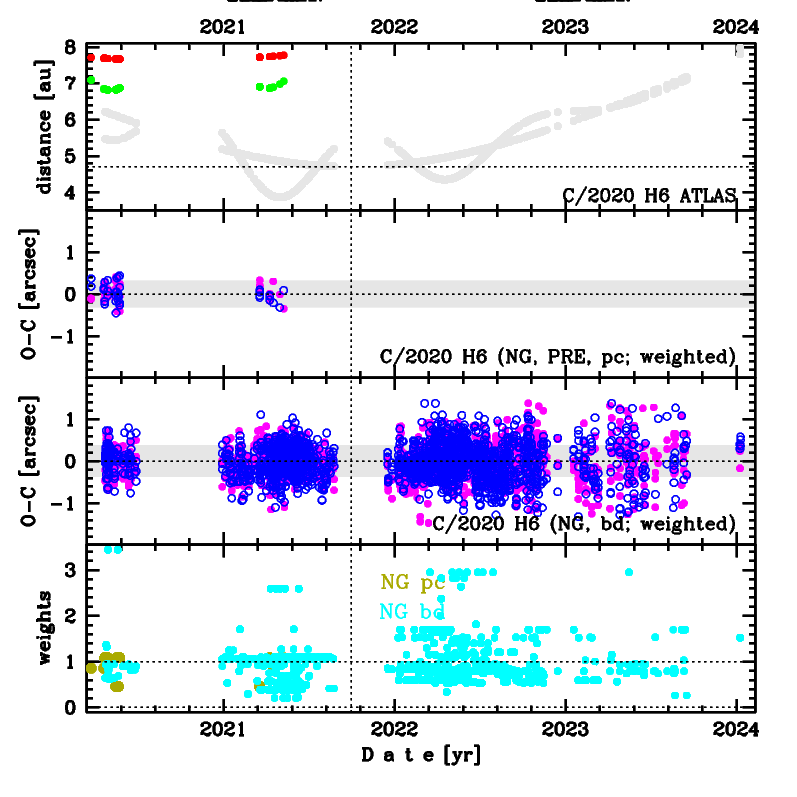
Upper panel: Time distribution of positional observations with corresponding heliocentric (red curve) and geocentric (green curve) distance at which they were taken. The horizontal dotted line shows the perihelion distance for a given comet whereas vertical dotted line — the moment of perihelion passage.
Middle panel(s): O-C diagram for a given solution (sometimes in comparison to another solution available in CODE), where residuals in right ascension are shown using magenta dots and in declination by blue open circles.
Lowest panel: Relative weights for a given data set(s).
Middle panel(s): O-C diagram for a given solution (sometimes in comparison to another solution available in CODE), where residuals in right ascension are shown using magenta dots and in declination by blue open circles.
Lowest panel: Relative weights for a given data set(s).
| previous_g orbit statistics, here only the Galactic tide has been included | ||
|---|---|---|
| no. of returning VCs in the swarm | 0 | |
| no. of escaping VCs in the swarm | 5002 | |
| no. of hyperbolas among escaping VCs in the swarm | 4553 | * |
| previous reciprocal semi-major axis [10-6 au-1] | -12.77 – -6.34 – -0.25 | |
| previous perihelion distance [au] | 21 – 24 – 27 | |
| previous aphelion distance [103 au] | 390 – 1200 – 7900 | |
| time interval to previous perihelion [Myr] | 2.35 ± 11.422 | |
| percentage of VCs with 10 < qprev < 20 | 5 | |
| percentage of VCs with qprev > 20 | 95 | |