C/2019 Q3 PanSTARRS
more info
Comet C/2019 Q3 was discovered on 29 August 2019, about 10.5 months after its perihelion passage; later a series of prediscovery images was found going back to 3 July 2019. This comet was observed only to 6 September 2019 and only on its post-perihelion leg of orbit.
Thus, the solution given here is based on post-perihelion data and span over 0.178 yr in a range of heliocentric distances from 7.53 au to 7.65 au.
This comet seems to be Oort spike comet with a bit tight future orbit than original orbit; however original and future semimajor axis is poorly known (see uncertainties of barycentric orbits).
| solution description | ||
|---|---|---|
| number of observations | 86 | |
| data interval | 2019 07 03 – 2019 09 06 | |
| data type | observed only after perihelion (POST) | |
| data arc selection | entire data set (STD) | |
| range of heliocentric distances | 7.53 au – 7.65au | |
| detectability of NG effects in the comet's motion | NG effects not determinable | |
| type of model of motion | GR - gravitational orbit | |
| data weighting | YES | |
| number of residuals | 165 | |
| RMS [arcseconds] | 0.18 | |
| orbit quality class | 2a | |
| orbital elements (heliocentric ecliptic J2000) | ||
|---|---|---|
| Epoch | 2018 07 21 | |
| perihelion date | 2018 08 19.80231938 | ± 0.41979707 |
| perihelion distance [au] | 7.24835426 | ± 0.00155624 |
| eccentricity | 1.00466168 | ± 0.00012975 |
| argument of perihelion [°] | 152.551187 | ± 0.035055 |
| ascending node [°] | 151.321768 | ± 0.000348 |
| inclination [°] | 65.544583 | ± 0.009888 |
| reciprocal semi-major axis [10-6 au-1] | -643.14 | ± 17.97 |
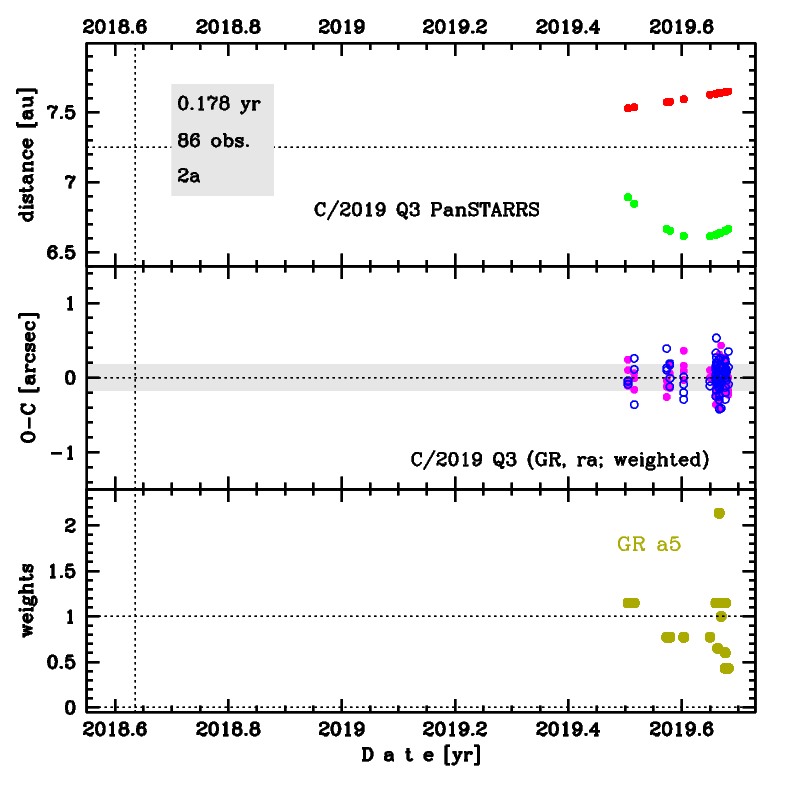
Upper panel: Time distribution of positional observations with corresponding heliocentric (red curve) and geocentric (green curve) distance at which they were taken. The horizontal dotted line shows the perihelion distance for a given comet whereas vertical dotted line — the moment of perihelion passage.
Middle panel(s): O-C diagram for a given solution (sometimes in comparison to another solution available in CODE), where residuals in right ascension are shown using magenta dots and in declination by blue open circles.
Lowest panel: Relative weights for a given data set(s).
Middle panel(s): O-C diagram for a given solution (sometimes in comparison to another solution available in CODE), where residuals in right ascension are shown using magenta dots and in declination by blue open circles.
Lowest panel: Relative weights for a given data set(s).