C/2017 M4 ATLAS
more info
Comet C/2017 M4 was discovered on 21 June 2017 by Asteroid Terrestrial-impact Last Alert System (ATLAS) Team, that is about a year and 7 months before its perihelion passage. Some prediscovery images of this comet were found: taken on 16 June 2017 by Pan-STARRS 1 telescope (Haleakala).
Solutions given here are based on data spanning over 4.46 yr in a range of heliocentric distances: 6.09 au – 3.252 au (perihelion) – 9.19 au.
NG orbits using full data-arc as well as independently using pre-perihelion and post-perihelion data are determinable.
See also Królikowska and Dones 2023.
| solution description | ||
|---|---|---|
| number of observations | 3284 | |
| data interval | 2017 06 16 – 2021 11 30 | |
| data type | perihelion within the observation arc (FULL) | |
| data arc selection | entire data set (STD) | |
| range of heliocentric distances | 6.09 au – 3.25 au (perihelion) – 9.19 au | |
| type of model of motion | NT - non-gravitational orbits for asymmetric, standard g(r) | |
| data weighting | YES | |
| number of residuals | 6492 | |
| RMS [arcseconds] | 0.47 | |
| orbit quality class | 1a+ | |
| orbital elements (barycentric ecliptic J2000) | ||
|---|---|---|
| Epoch | 1716 04 15 | |
| perihelion date | 2019 01 18.65410284 | ± 0.00013437 |
| perihelion distance [au] | 3.24472559 | ± 0.00000111 |
| eccentricity | 0.99982068 | ± 0.00000131 |
| argument of perihelion [°] | 167.764219 | ± 0.000032 |
| ascending node [°] | 65.816172 | ± 0.000008 |
| inclination [°] | 105.658087 | ± 0.000004 |
| reciprocal semi-major axis [10-6 au-1] | 55.27 | ± 0.40 |
| file containing 5001 VCs swarm |
|---|
| 2017m4bt.bmi |
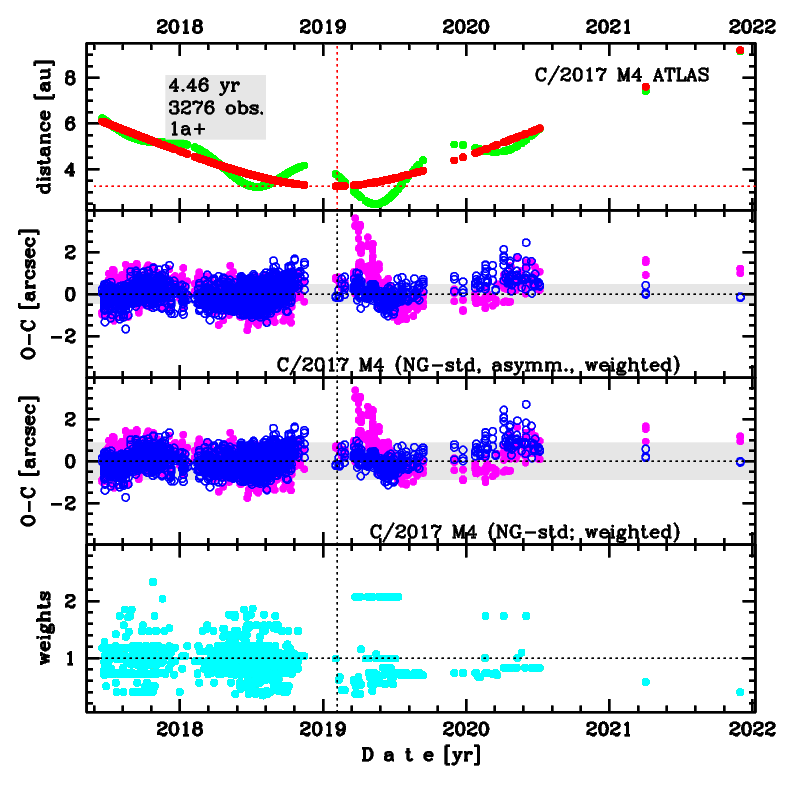
Upper panel: Time distribution of positional observations with corresponding heliocentric (red curve) and geocentric (green curve) distance at which they were taken. The horizontal dotted line shows the perihelion distance for a given comet whereas vertical dotted line — the moment of perihelion passage.
Middle panel(s): O-C diagram for a given solution (sometimes in comparison to another solution available in CODE), where residuals in right ascension are shown using magenta dots and in declination by blue open circles.
Lowest panel: Relative weights for a given data set(s).
Middle panel(s): O-C diagram for a given solution (sometimes in comparison to another solution available in CODE), where residuals in right ascension are shown using magenta dots and in declination by blue open circles.
Lowest panel: Relative weights for a given data set(s).
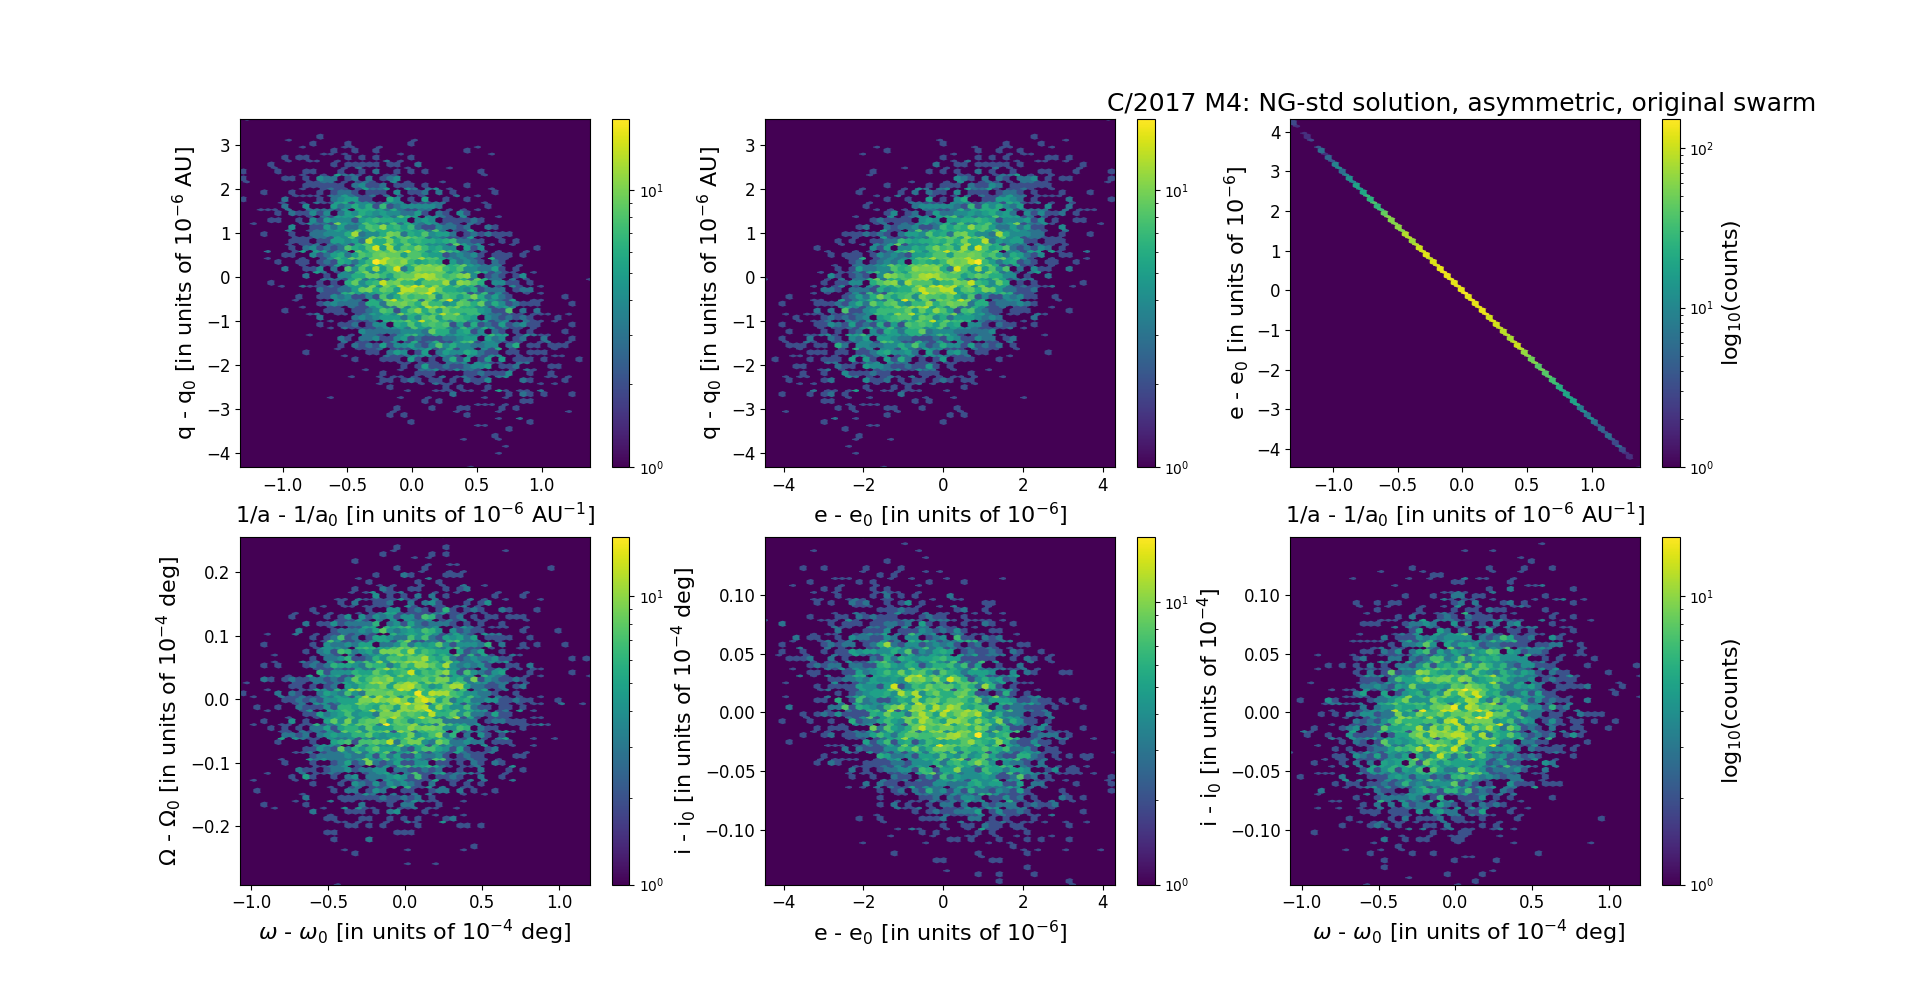
Six 2D-projections of the 6D space of original swarm including 5001 VCs. Each density map is given in logarithmic scale presented on the right in the individual panel.