C/2017 AB5 PANSTARRS
more info
Comet C/2017 AB5 was discovered on 3 January 2017 with Pan-STARRS 1 telescope (Haleakala), that is more than a year before its perihelion passage. This comet was rather rarely observed until 25 April 2019.
Comet had its closest approach to the Earth on 18 January 2018 (8.395 au), about a month before its perihelion passage.
The preferred solution given here is based on data spanning over 2.31 yr in a range of heliocentric distances: 9.50 au – 9.22 au (perihelion) – 9.53 au.
This Oort spike comet suffers small planetary perturbations during its passage through the planetary system and will have a bit more tight future orbit (see future barycentric orbit).
| solution description | ||
|---|---|---|
| number of observations | 85 | |
| data interval | 2017 01 03 – 2019 04 25 | |
| data type | perihelion within the observation arc (FULL) | |
| data arc selection | entire data set (STD) | |
| range of heliocentric distances | 9.5 au – 9.22 au (perihelion) – 9.53 au | |
| detectability of NG effects in the comet's motion | NG effects not determinable | |
| type of model of motion | GR - gravitational orbit | |
| data weighting | NO | |
| number of residuals | 158 | |
| RMS [arcseconds] | 0.37 | |
| orbit quality class | 1a | |
| orbital elements (barycentric ecliptic J2000) | ||
|---|---|---|
| Epoch | 2332 08 24 | |
| perihelion date | 2018 02 16.66134550 | ± 0.00918553 |
| perihelion distance [au] | 9.22208312 | ± 0.00003431 |
| eccentricity | 0.99837899 | ± 0.00002152 |
| argument of perihelion [°] | 78.400500 | ± 0.000464 |
| ascending node [°] | 42.623963 | ± 0.000099 |
| inclination [°] | 32.417261 | ± 0.000019 |
| reciprocal semi-major axis [10-6 au-1] | 175.77 | ± 2.33 |
| file containing 5001 VCs swarm |
|---|
| 2017abb1.bpl |
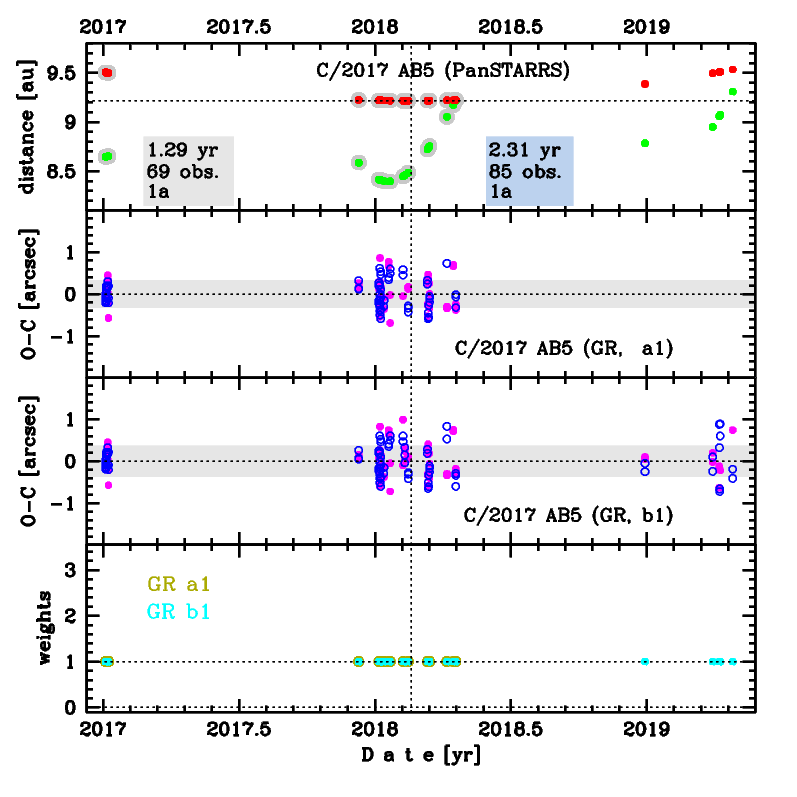
Upper panel: Time distribution of positional observations with corresponding heliocentric (red curve) and geocentric (green curve) distance at which they were taken. The horizontal dotted line shows the perihelion distance for a given comet whereas vertical dotted line — the moment of perihelion passage.
Middle panel(s): O-C diagram for a given solution (sometimes in comparison to another solution available in CODE), where residuals in right ascension are shown using magenta dots and in declination by blue open circles.
Lowest panel: Relative weights for a given data set(s).
Middle panel(s): O-C diagram for a given solution (sometimes in comparison to another solution available in CODE), where residuals in right ascension are shown using magenta dots and in declination by blue open circles.
Lowest panel: Relative weights for a given data set(s).
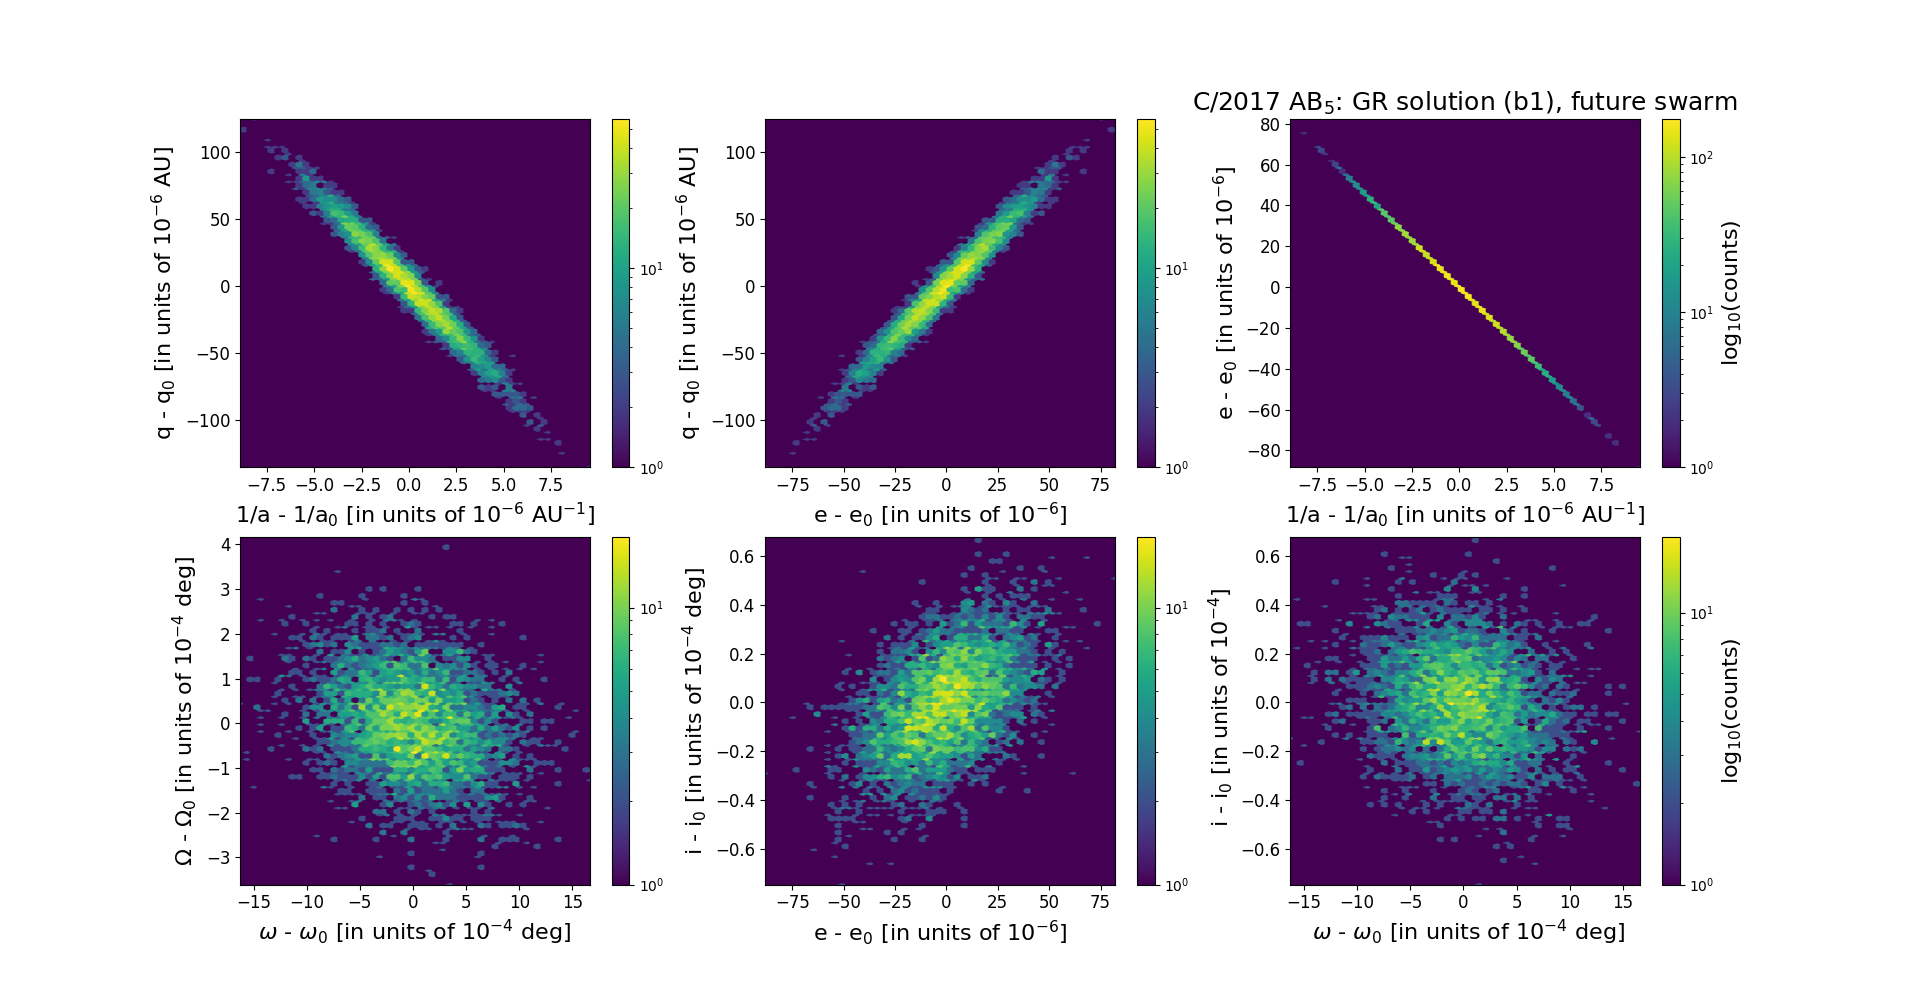
Six 2D-projections of the 6D space of future swarm including 5001 VCs. Each density map is given in logarithmic scale presented on the right in the individual panel.