C/2016 N4 Master
more info
Comet C/2016 N4 was discovered on 15 July 2016 with Mobile Astronomical System of the Telescope-Robots (MASTER), that is about months after its perihelion passage.
Some prediscovery images of this comet were found: taken on 11 September 2015 by ISON-SSO Observatory (Siding Spring).
Solutions given here are based on data spanning over 4.54 yr in a range of heliocentric distances: 7.14 au – 3.199 au (perihelion) – 8.37 au.
NG orbits using full data-arc as well as independently using pre-perihelion and post-perihelion data are determinable.
See also Królikowska and Dones 2023.
| solution description | ||
|---|---|---|
| number of observations | 1045 | |
| data interval | 2017 09 16 – 2020 03 26 | |
| data arc selection | data generally limited to post-perihelion (POS) | |
| range of heliocentric distances | 3.2 au – 3.20 au (perihelion) – 8.37 au | |
| detectability of NG effects in the comet's motion | comet with determinable NG~orbit | |
| type of model of motion | GR - gravitational orbit | |
| data weighting | YES | |
| number of residuals | 2065 | |
| RMS [arcseconds] | 0.44 | |
| orbit quality class | 1a+ | |
| orbital elements (barycentric ecliptic J2000) | ||
|---|---|---|
| Epoch | 2322 05 09 | |
| perihelion date | 2017 09 16.32044950 | ± 0.00018379 |
| perihelion distance [au] | 3.20145786 | ± 0.00000215 |
| eccentricity | 0.99926680 | ± 0.00000162 |
| argument of perihelion [°] | 55.976506 | ± 0.000060 |
| ascending node [°] | 353.991886 | ± 0.000010 |
| inclination [°] | 72.487679 | ± 0.000006 |
| reciprocal semi-major axis [10-6 au-1] | 229.02 | ± 0.51 |
| file containing 5001 VCs swarm |
|---|
| 2016n4ra.bpl |
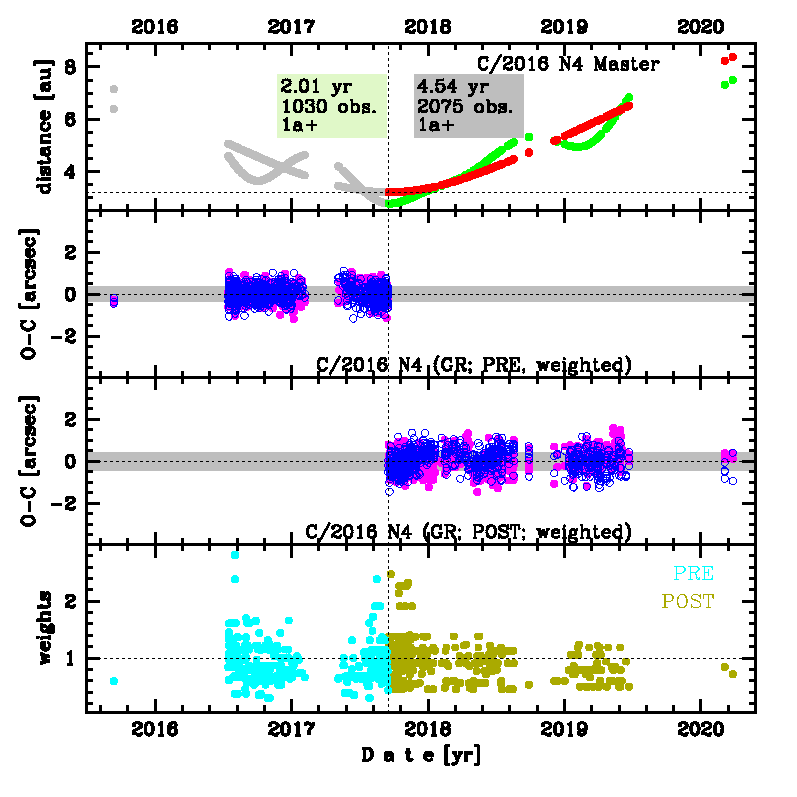
Upper panel: Time distribution of positional observations with corresponding heliocentric (red curve) and geocentric (green curve) distance at which they were taken. The horizontal dotted line shows the perihelion distance for a given comet whereas vertical dotted line — the moment of perihelion passage.
Middle panel(s): O-C diagram for a given solution (sometimes in comparison to another solution available in CODE), where residuals in right ascension are shown using magenta dots and in declination by blue open circles.
Lowest panel: Relative weights for a given data set(s).
Middle panel(s): O-C diagram for a given solution (sometimes in comparison to another solution available in CODE), where residuals in right ascension are shown using magenta dots and in declination by blue open circles.
Lowest panel: Relative weights for a given data set(s).
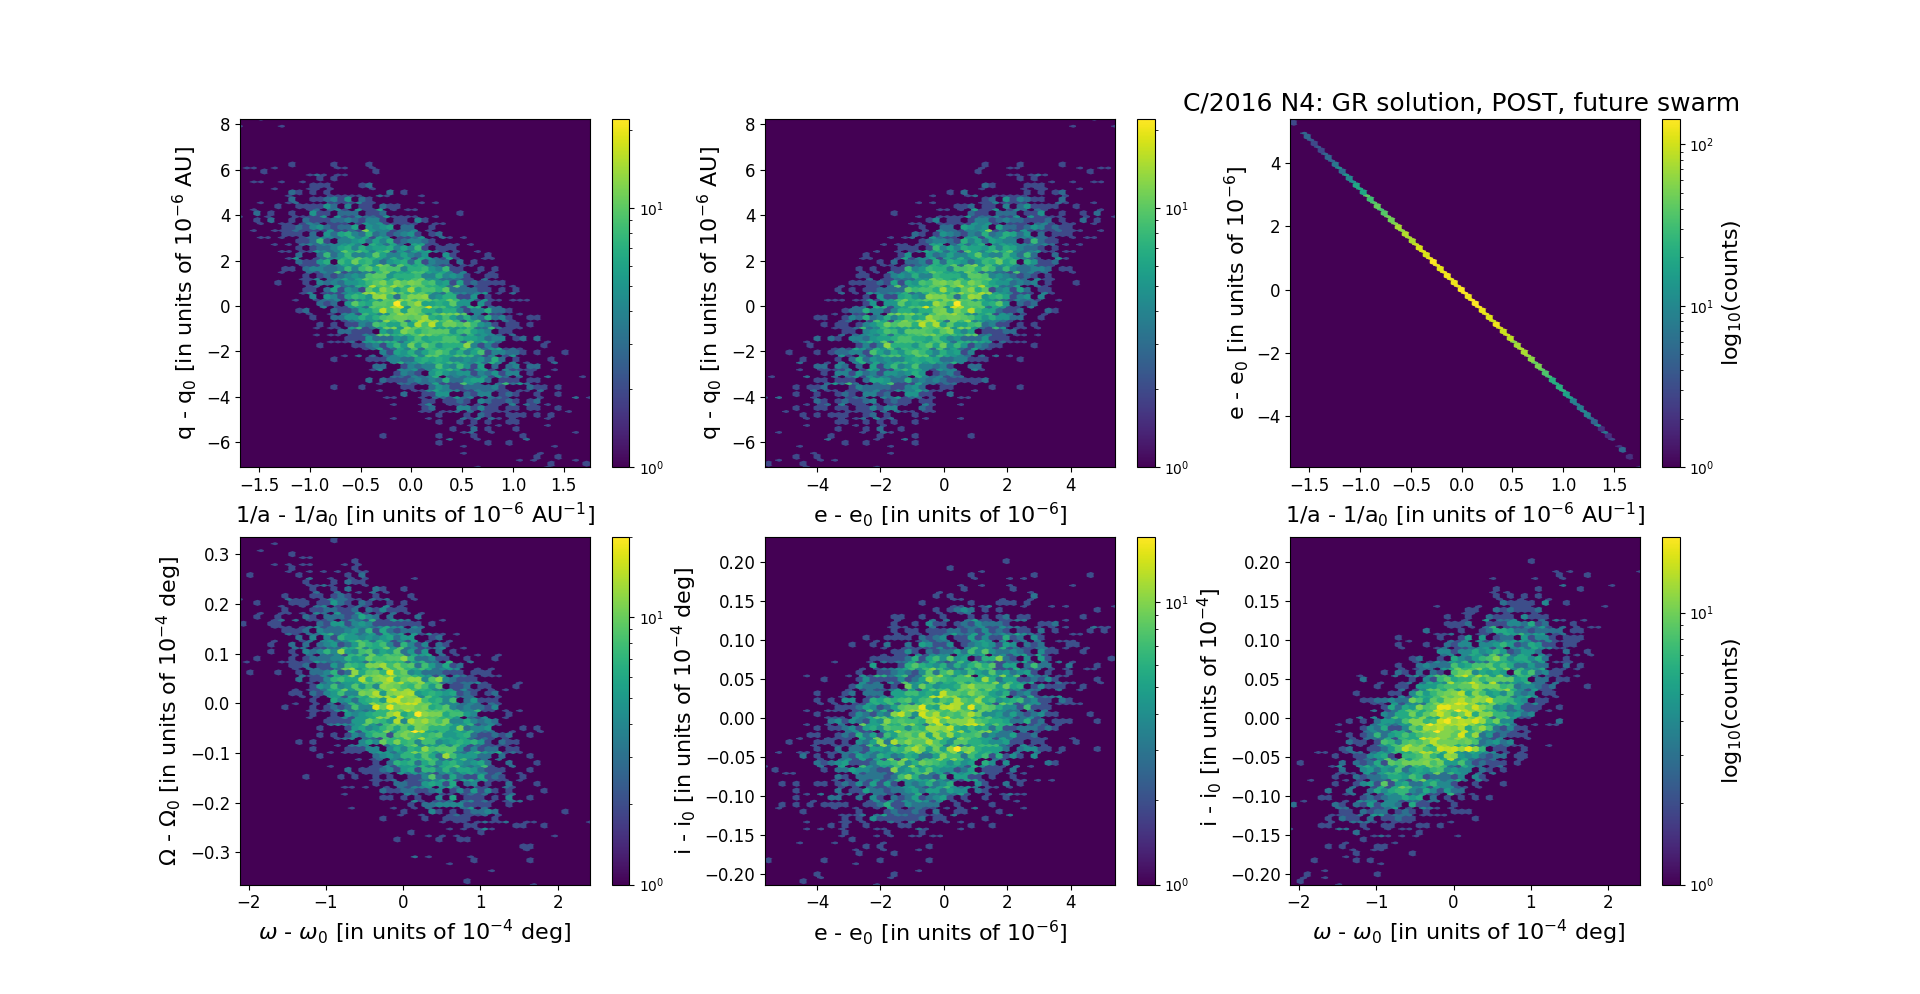
Six 2D-projections of the 6D space of future swarm including 5001 VCs. Each density map is given in logarithmic scale presented on the right in the individual panel.