C/2016 N4 Master
more info
Comet C/2016 N4 was discovered on 15 July 2016 with Mobile Astronomical System of the Telescope-Robots (MASTER), that is about months after its perihelion passage.
Some prediscovery images of this comet were found: taken on 11 September 2015 by ISON-SSO Observatory (Siding Spring).
Solutions given here are based on data spanning over 4.54 yr in a range of heliocentric distances: 7.14 au – 3.199 au (perihelion) – 8.37 au.
NG orbits using full data-arc as well as independently using pre-perihelion and post-perihelion data are determinable.
See also Królikowska and Dones 2023.
| solution description | ||
|---|---|---|
| number of observations | 1030 | |
| data interval | 2015 09 11 – 2017 09 16 | |
| data arc selection | data generally limited to pre-perihelion (PRE) | |
| range of heliocentric distances | 7.14 au – 3.20 au (perihelion) – 3.2 au | |
| type of model of motion | NH - non-gravitational orbits for water sublimation from subsolar point | |
| data weighting | YES | |
| number of residuals | 2031 | |
| RMS [arcseconds] | 0.33 | |
| orbit quality class | 1a | |
| orbital elements (barycentric ecliptic J2000) | ||
|---|---|---|
| Epoch | 1713 07 20 | |
| perihelion date | 2017 09 16.08251301 | ± 0.00072371 |
| perihelion distance [au] | 3.20055389 | ± 0.00000372 |
| eccentricity | 0.99942230 | ± 0.00000561 |
| argument of perihelion [°] | 55.963117 | ± 0.000115 |
| ascending node [°] | 354.088836 | ± 0.000012 |
| inclination [°] | 72.512904 | ± 0.000055 |
| reciprocal semi-major axis [10-6 au-1] | 180.50 | ± 1.75 |
| file containing 5001 VCs swarm |
|---|
| 2016n4ps.bmi |
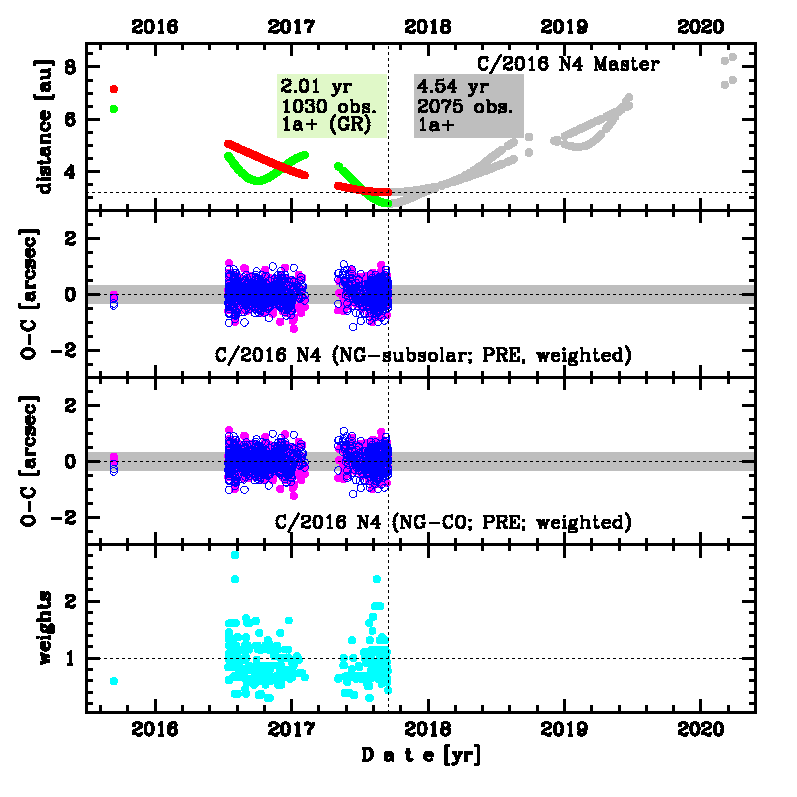
Upper panel: Time distribution of positional observations with corresponding heliocentric (red curve) and geocentric (green curve) distance at which they were taken. The horizontal dotted line shows the perihelion distance for a given comet whereas vertical dotted line — the moment of perihelion passage.
Middle panel(s): O-C diagram for a given solution (sometimes in comparison to another solution available in CODE), where residuals in right ascension are shown using magenta dots and in declination by blue open circles.
Lowest panel: Relative weights for a given data set(s).
Middle panel(s): O-C diagram for a given solution (sometimes in comparison to another solution available in CODE), where residuals in right ascension are shown using magenta dots and in declination by blue open circles.
Lowest panel: Relative weights for a given data set(s).
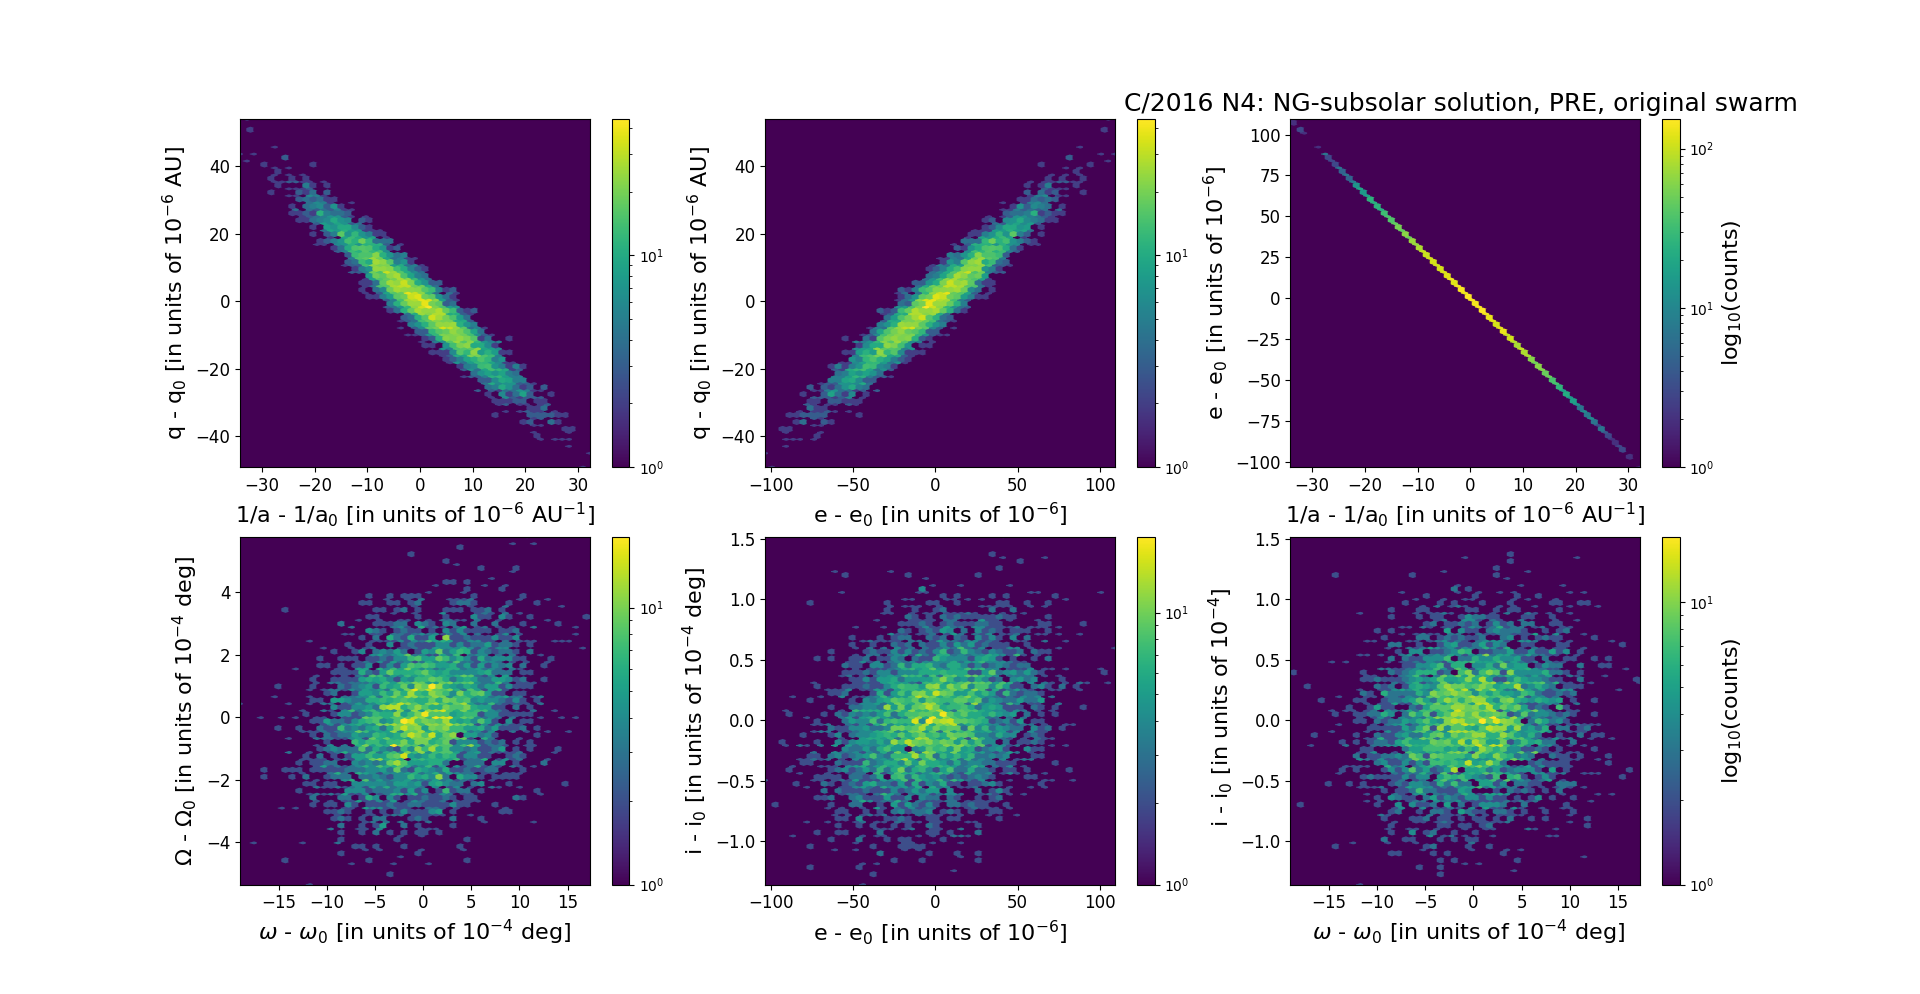
Six 2D-projections of the 6D space of original swarm including 5001 VCs. Each density map is given in logarithmic scale presented on the right in the individual panel.