C/2016 KA Catalina
more info
Comet C/2016 KA was discovered on 16 May 2016 with Catalina Sky Survey, that is about 3.5 months after its perihelion passage. This comet was observed about three months until 3 April 2017.
Comet had its closest approach to the Earth on 2 June 2016 (5.240 au), about 4 months after its perihelion passage and about 2 weeks after its discovery.
The preferred solution given here is based on data spanning over 0.88 yr in a range of heliocentric distances from 5.46 au to 6.24 au.
This comet suffers insignificant planetary perturbations during its passage through the planetary system; have orignal and future semimajor axes shorter than 5000 au.
| solution description | ||
|---|---|---|
| number of observations | 75 | |
| data interval | 2016 05 16 – 2016 08 22 | |
| data type | observed only after perihelion (POST) | |
| data arc selection | entire data set (STD) | |
| range of heliocentric distances | 5.46 au – 5.56au | |
| detectability of NG effects in the comet's motion | NG effects not determinable | |
| type of model of motion | GR - gravitational orbit | |
| data weighting | NO | |
| number of residuals | 144 | |
| RMS [arcseconds] | 0.47 | |
| orbit quality class | 2a | |
| orbital elements (barycentric ecliptic J2000) | ||
|---|---|---|
| Epoch | 2324 07 17 | |
| perihelion date | 2016 02 01.83000236 | ± 0.03786131 |
| perihelion distance [au] | 5.40056475 | ± 0.00008841 |
| eccentricity | 0.99881326 | ± 0.00016673 |
| argument of perihelion [°] | 63.129962 | ± 0.004472 |
| ascending node [°] | 317.539346 | ± 0.000944 |
| inclination [°] | 104.582415 | ± 0.00011 |
| reciprocal semi-major axis [10-6 au-1] | 219.74 | ± 30.87 |
| file containing 5001 VCs swarm |
|---|
| 2016kaa1.bpl |
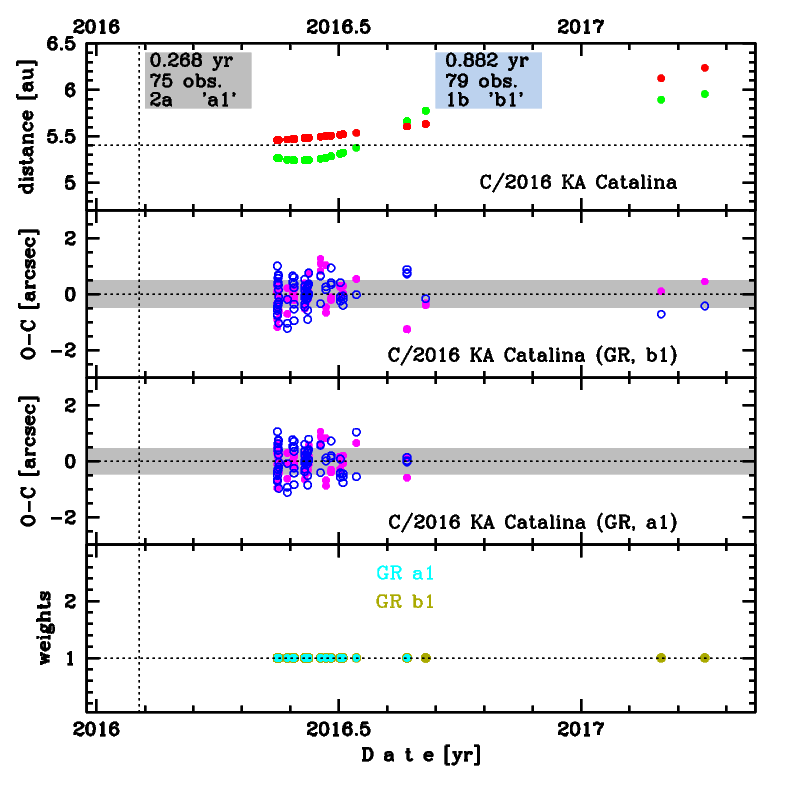
Upper panel: Time distribution of positional observations with corresponding heliocentric (red curve) and geocentric (green curve) distance at which they were taken. The horizontal dotted line shows the perihelion distance for a given comet whereas vertical dotted line — the moment of perihelion passage.
Middle panel(s): O-C diagram for a given solution (sometimes in comparison to another solution available in CODE), where residuals in right ascension are shown using magenta dots and in declination by blue open circles.
Lowest panel: Relative weights for a given data set(s).
Middle panel(s): O-C diagram for a given solution (sometimes in comparison to another solution available in CODE), where residuals in right ascension are shown using magenta dots and in declination by blue open circles.
Lowest panel: Relative weights for a given data set(s).
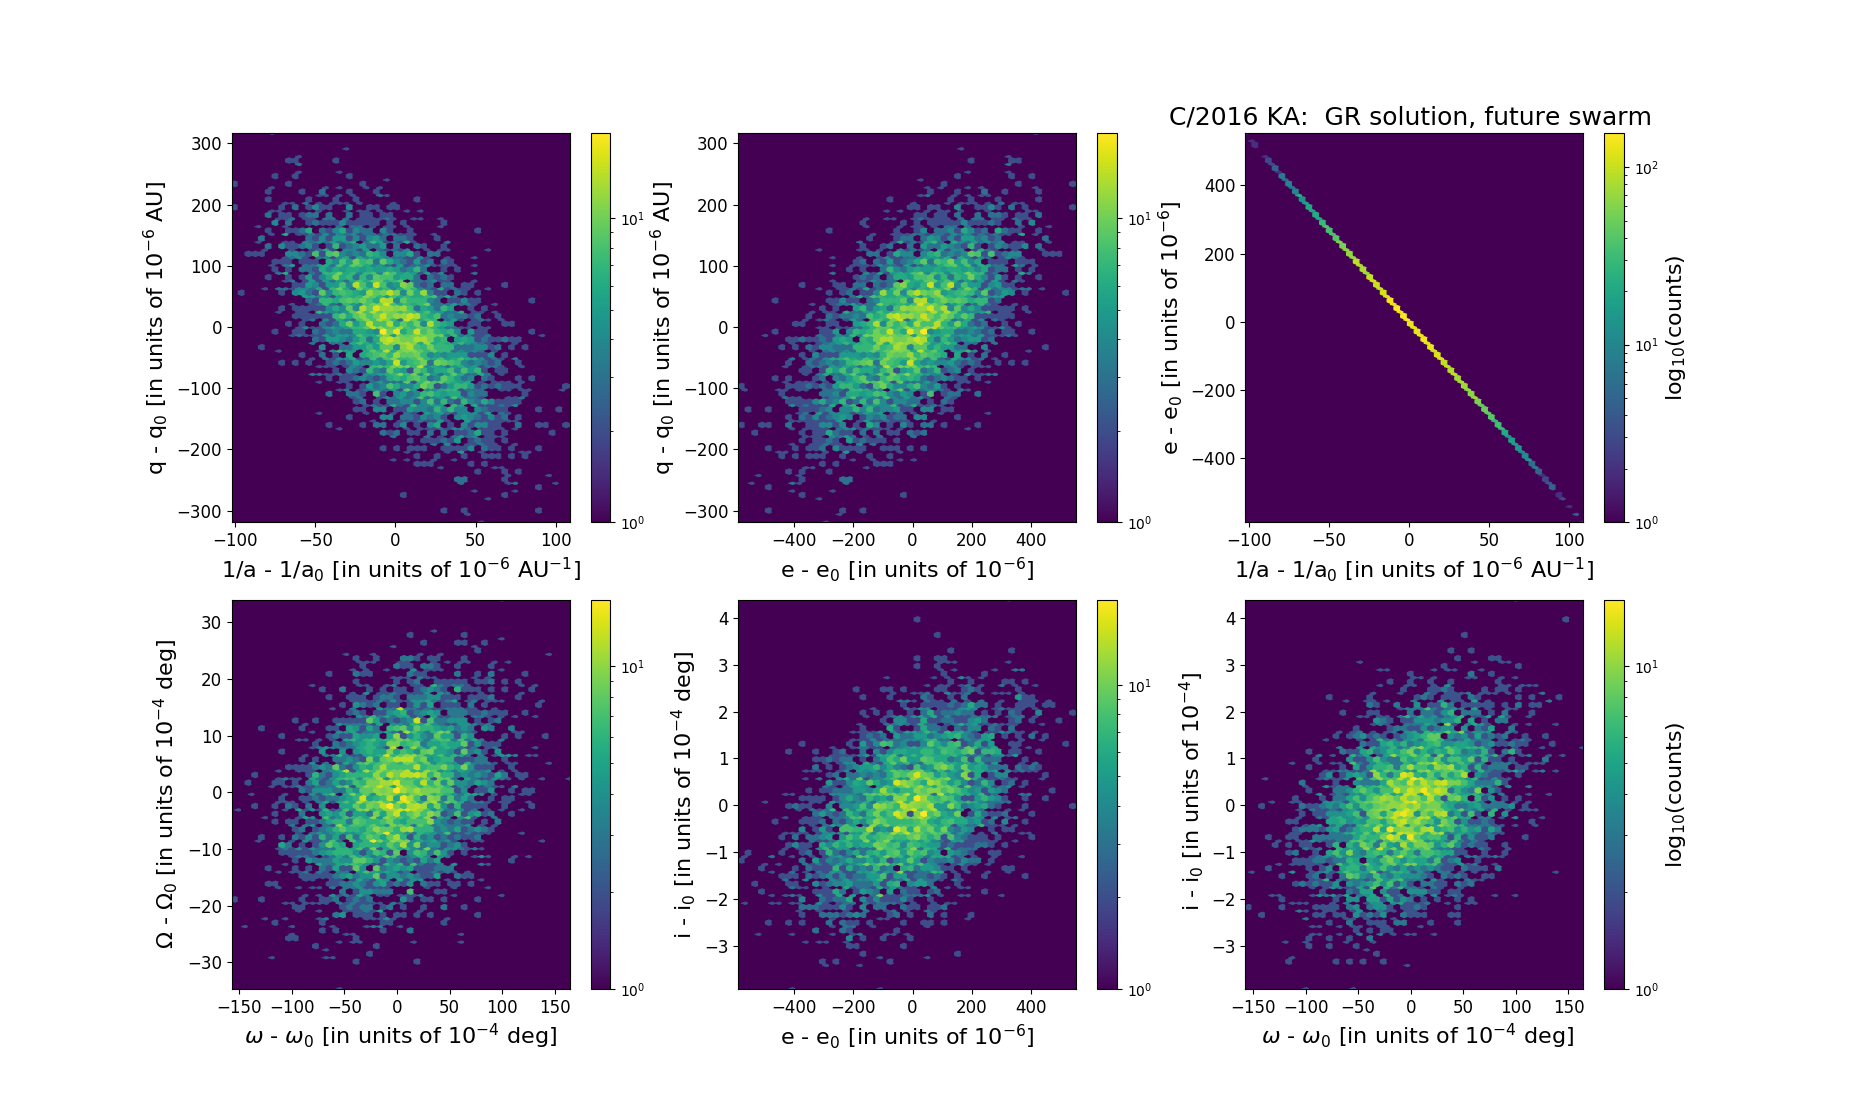
Six 2D-projections of the 6D space of future swarm including 5001 VCs. Each density map is given in logarithmic scale presented on the right in the individual panel.