C/2016 E1 PANSTARRS
more info
Comet C/2016 E1 was discovered on 3 March 2016 with Pan-STARRS 1 telescope (Haleakala), that is about 1.3 yr before its perihelion passage. This comet was observed until 1 January 2020.
Comet had its closest approach to the Earth on 10 April 2017 (7.345 au), almost 2 months before its perihelion passage.
The preferred solution given here is based on data spanning over 3.83 yr in a range of heliocentric distances: 8.62 au – 8.18 au (perihelion) – 9.90 au.
This Oort spike comet suffers rather small planetary perturbations during its passage through the planetary system; however, these perturbations likely lead to escape the comet from the planetary zone on a hyperbolic orbit (see future barycentric orbits).
| solution description | ||
|---|---|---|
| number of observations | 164 | |
| data interval | 2016 03 03 – 2019 04 25 | |
| data type | perihelion within the observation arc (FULL) | |
| data arc selection | entire data set (STD) | |
| range of heliocentric distances | 8.62 au – 8.18 au (perihelion) – 9.16 au | |
| detectability of NG effects in the comet's motion | NG effects not determinable | |
| type of model of motion | GR - gravitational orbit | |
| data weighting | YES | |
| number of residuals | 315 | |
| RMS [arcseconds] | 0.23 | |
| orbit quality class | 1a+ | |
| orbital elements (barycentric ecliptic J2000) | ||
|---|---|---|
| Epoch | 1706 04 28 | |
| perihelion date | 2017 06 03.34160403 | ± 0.00188950 |
| perihelion distance [au] | 8.15995561 | ± 0.00001132 |
| eccentricity | 0.99965406 | ± 0.00000867 |
| argument of perihelion [°] | 47.474402 | ± 0.000110 |
| ascending node [°] | 233.045361 | ± 0.000013 |
| inclination [°] | 132.068214 | ± 0.000015 |
| reciprocal semi-major axis [10-6 au-1] | 42.39 | ± 1.06 |
| file containing 5001 VCs swarm |
|---|
| 2016e1b5.bmi |
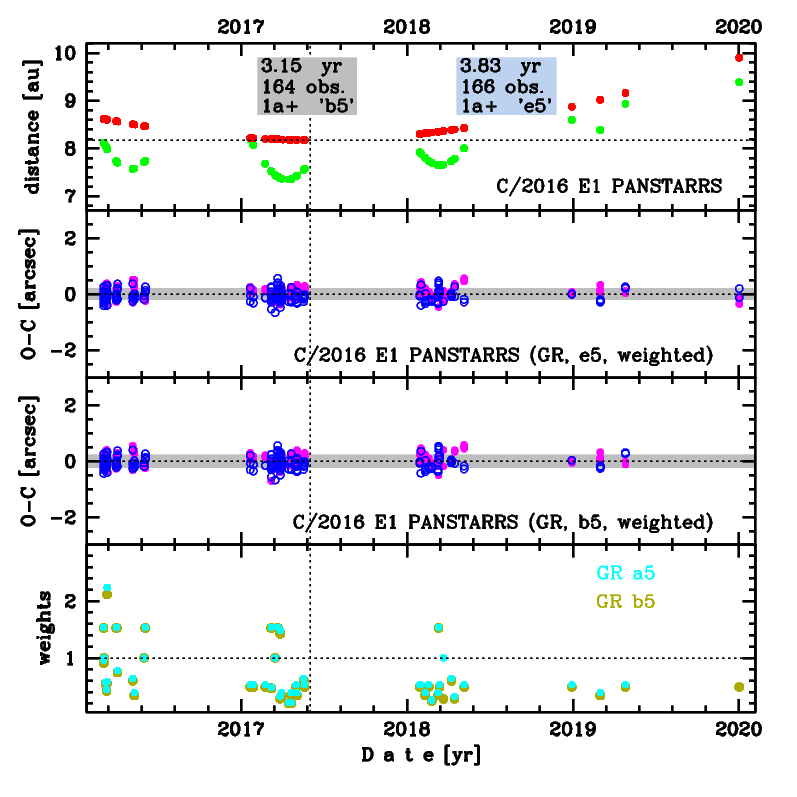
Upper panel: Time distribution of positional observations with corresponding heliocentric (red curve) and geocentric (green curve) distance at which they were taken. The horizontal dotted line shows the perihelion distance for a given comet whereas vertical dotted line — the moment of perihelion passage.
Middle panel(s): O-C diagram for a given solution (sometimes in comparison to another solution available in CODE), where residuals in right ascension are shown using magenta dots and in declination by blue open circles.
Lowest panel: Relative weights for a given data set(s).
Middle panel(s): O-C diagram for a given solution (sometimes in comparison to another solution available in CODE), where residuals in right ascension are shown using magenta dots and in declination by blue open circles.
Lowest panel: Relative weights for a given data set(s).
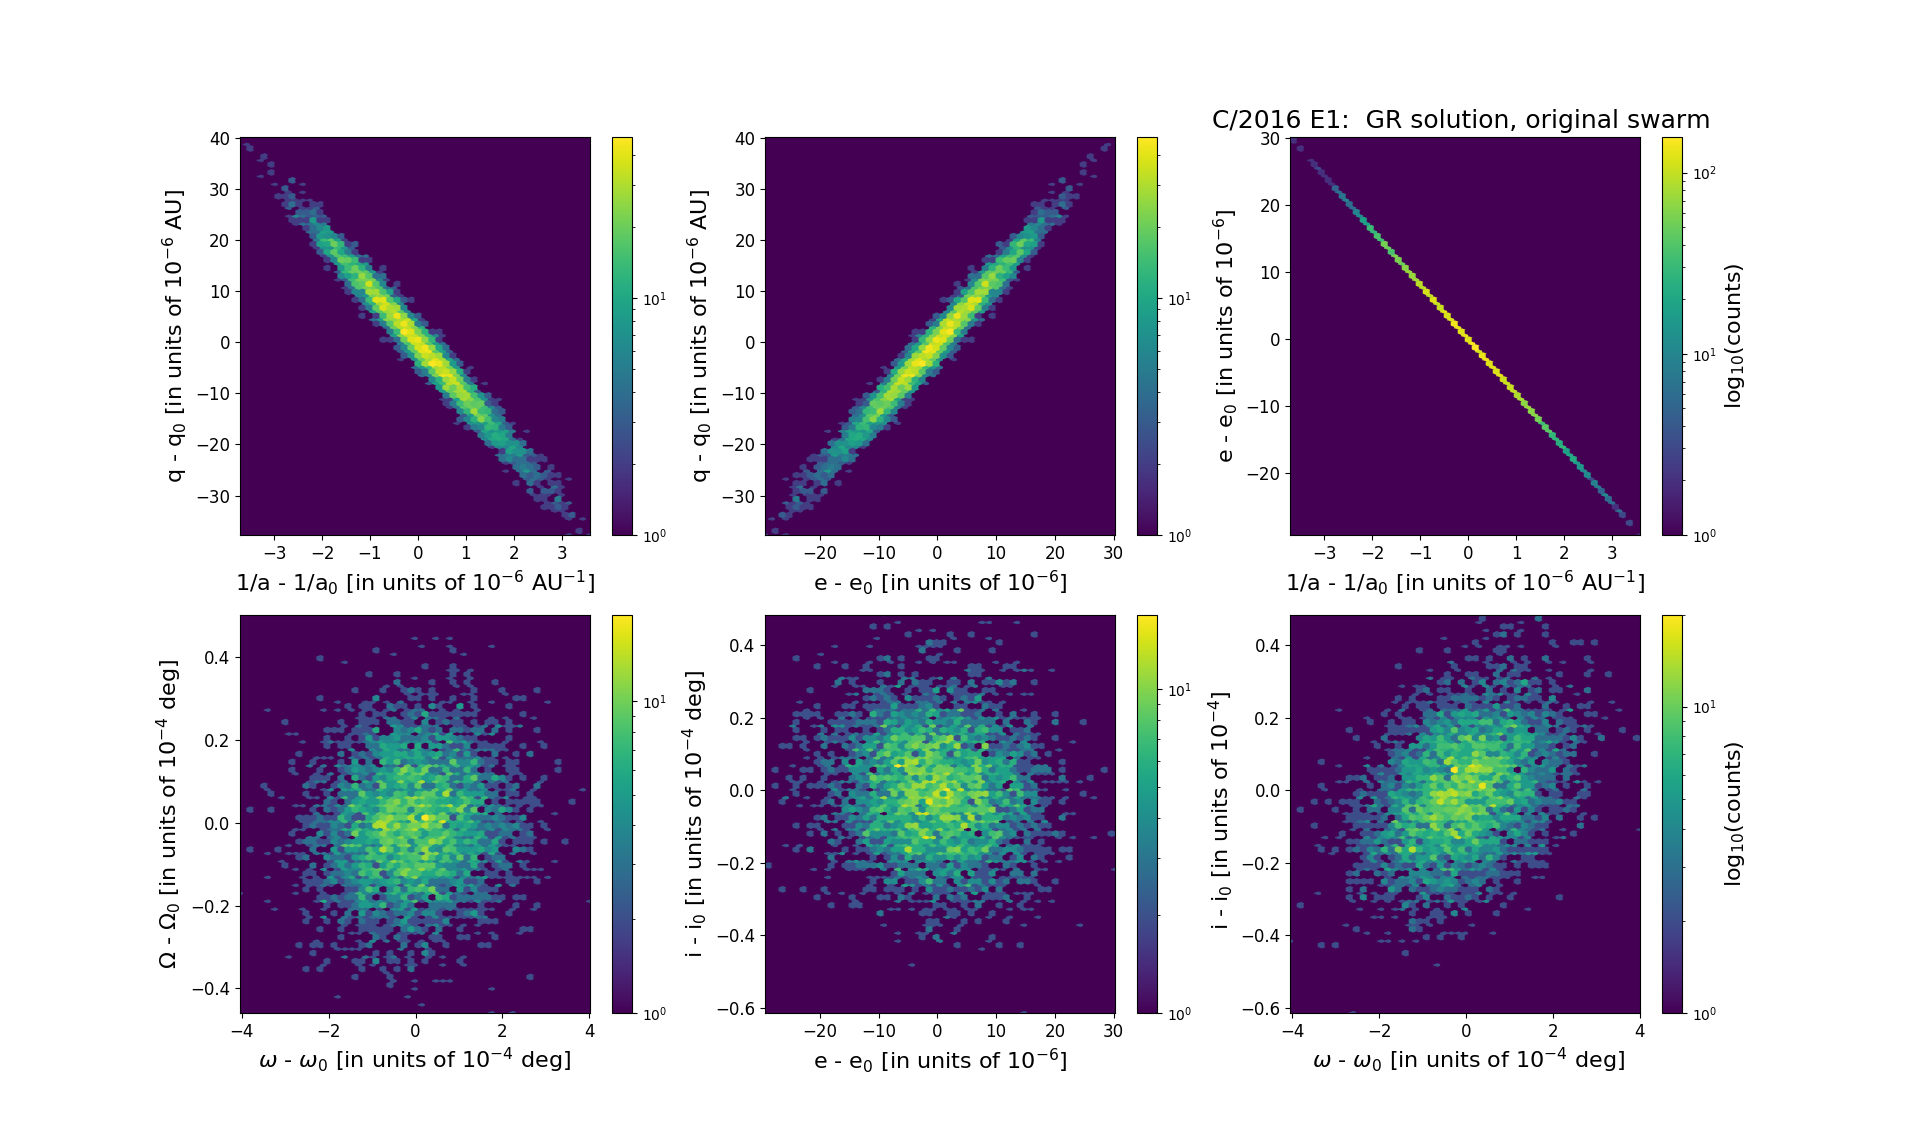
Six 2D-projections of the 6D space of original swarm including 5001 VCs. Each density map is given in logarithmic scale presented on the right in the individual panel.