C/2015 X5 PANSTARRS
more info
Comet C/2015 X5 was discovered on 6 December 2015 with Pan-STARRS 1 telescope (Haleakala), that is almost 2 years before its perihelion passage.
Comet had its closest approach to the Earth on 4 January 2018 (5.909 au); 4 days after its perihelion passage.
The preferred solution given here is based on data spanning over 4.19 yr in a range of heliocentric distances: 8.38 au – 6.80 au (perihelion) – 8.45 au.
This Oort spike comet suffers tiny planetary perturbations.
| solution description | ||
|---|---|---|
| number of observations | 171 | |
| data interval | 2015 12 06 – 2018 02 08 | |
| data arc selection | data generally limited to pre-perihelion (PRE) | |
| range of heliocentric distances | 8.38 au – 6.80 au (perihelion) – 6.81 au | |
| detectability of NG effects in the comet's motion | NG effects not determinable | |
| type of model of motion | GR - gravitational orbit | |
| data weighting | YES | |
| number of residuals | 332 | |
| RMS [arcseconds] | 0.22 | |
| orbit quality class | 1a+ | |
| next orbit statistics, both Galactic and stellar perturbations were taken into account | ||
|---|---|---|
| no. of returning VCs in the swarm | 5001 | * |
| no. of escaping VCs in the swarm | 0 | |
| no. of hyperbolas among escaping VCs in the swarm | 0 | |
| next reciprocal semi-major axis [10-6 au-1] | 36.50 – 37.23 – 37.96 | |
| next perihelion distance [au] | 20.6 – 20.8 – 21.1 | |
| next aphelion distance [103 au] | 52.7 – 53.7 – 54.8 | |
| time interval to next perihelion [Myr] | 4.25 – 4.37 – 4.5 | |
| percentage of VCs with qnext > 20 | 100 | |
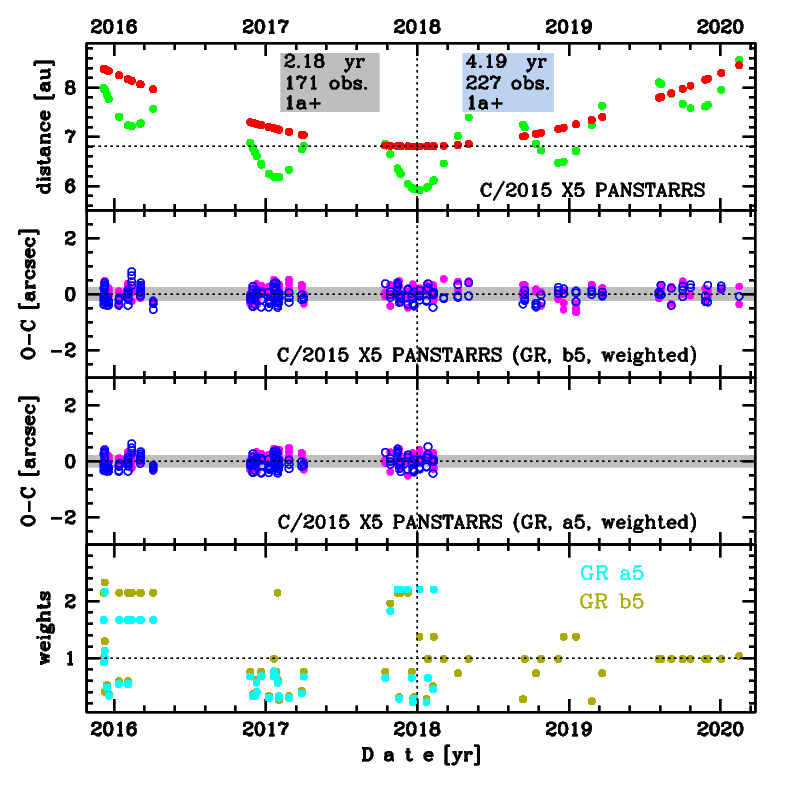
Upper panel: Time distribution of positional observations with corresponding heliocentric (red curve) and geocentric (green curve) distance at which they were taken. The horizontal dotted line shows the perihelion distance for a given comet whereas vertical dotted line — the moment of perihelion passage.
Middle panel(s): O-C diagram for a given solution (sometimes in comparison to another solution available in CODE), where residuals in right ascension are shown using magenta dots and in declination by blue open circles.
Lowest panel: Relative weights for a given data set(s).
Middle panel(s): O-C diagram for a given solution (sometimes in comparison to another solution available in CODE), where residuals in right ascension are shown using magenta dots and in declination by blue open circles.
Lowest panel: Relative weights for a given data set(s).
| next_g orbit statistics, here only the Galactic tide has been included | ||
|---|---|---|
| no. of returning VCs in the swarm | 5001 | * |
| no. of escaping VCs in the swarm | 0 | |
| no. of hyperbolas among escaping VCs in the swarm | 0 | |
| next reciprocal semi-major axis [10-6 au-1] | 36.14 – 36.87 – 37.61 | |
| next perihelion distance [au] | 13.5 – 14.4 – 15.3 | |
| next aphelion distance [103 au] | 53.2 – 54.2 – 55.3 | |
| time interval to next perihelion [Myr] | 4.33 – 4.46 – 4.6 | |
| percentage of VCs with 10 < qnext < 20 | 100 | |