C/2007 W1 Boattini
more info
Comet C/2007 W1 was discovered on 20 November 2007 by A. Boattini (Mt. Lemmon Survey), that is about seven months before perihelion passage. It was observed until 17 December 2008.
Comet had its closest approach to the Earth on 12 June 2008 (0.210 au), less than 2 weeks before its perihelion passage.
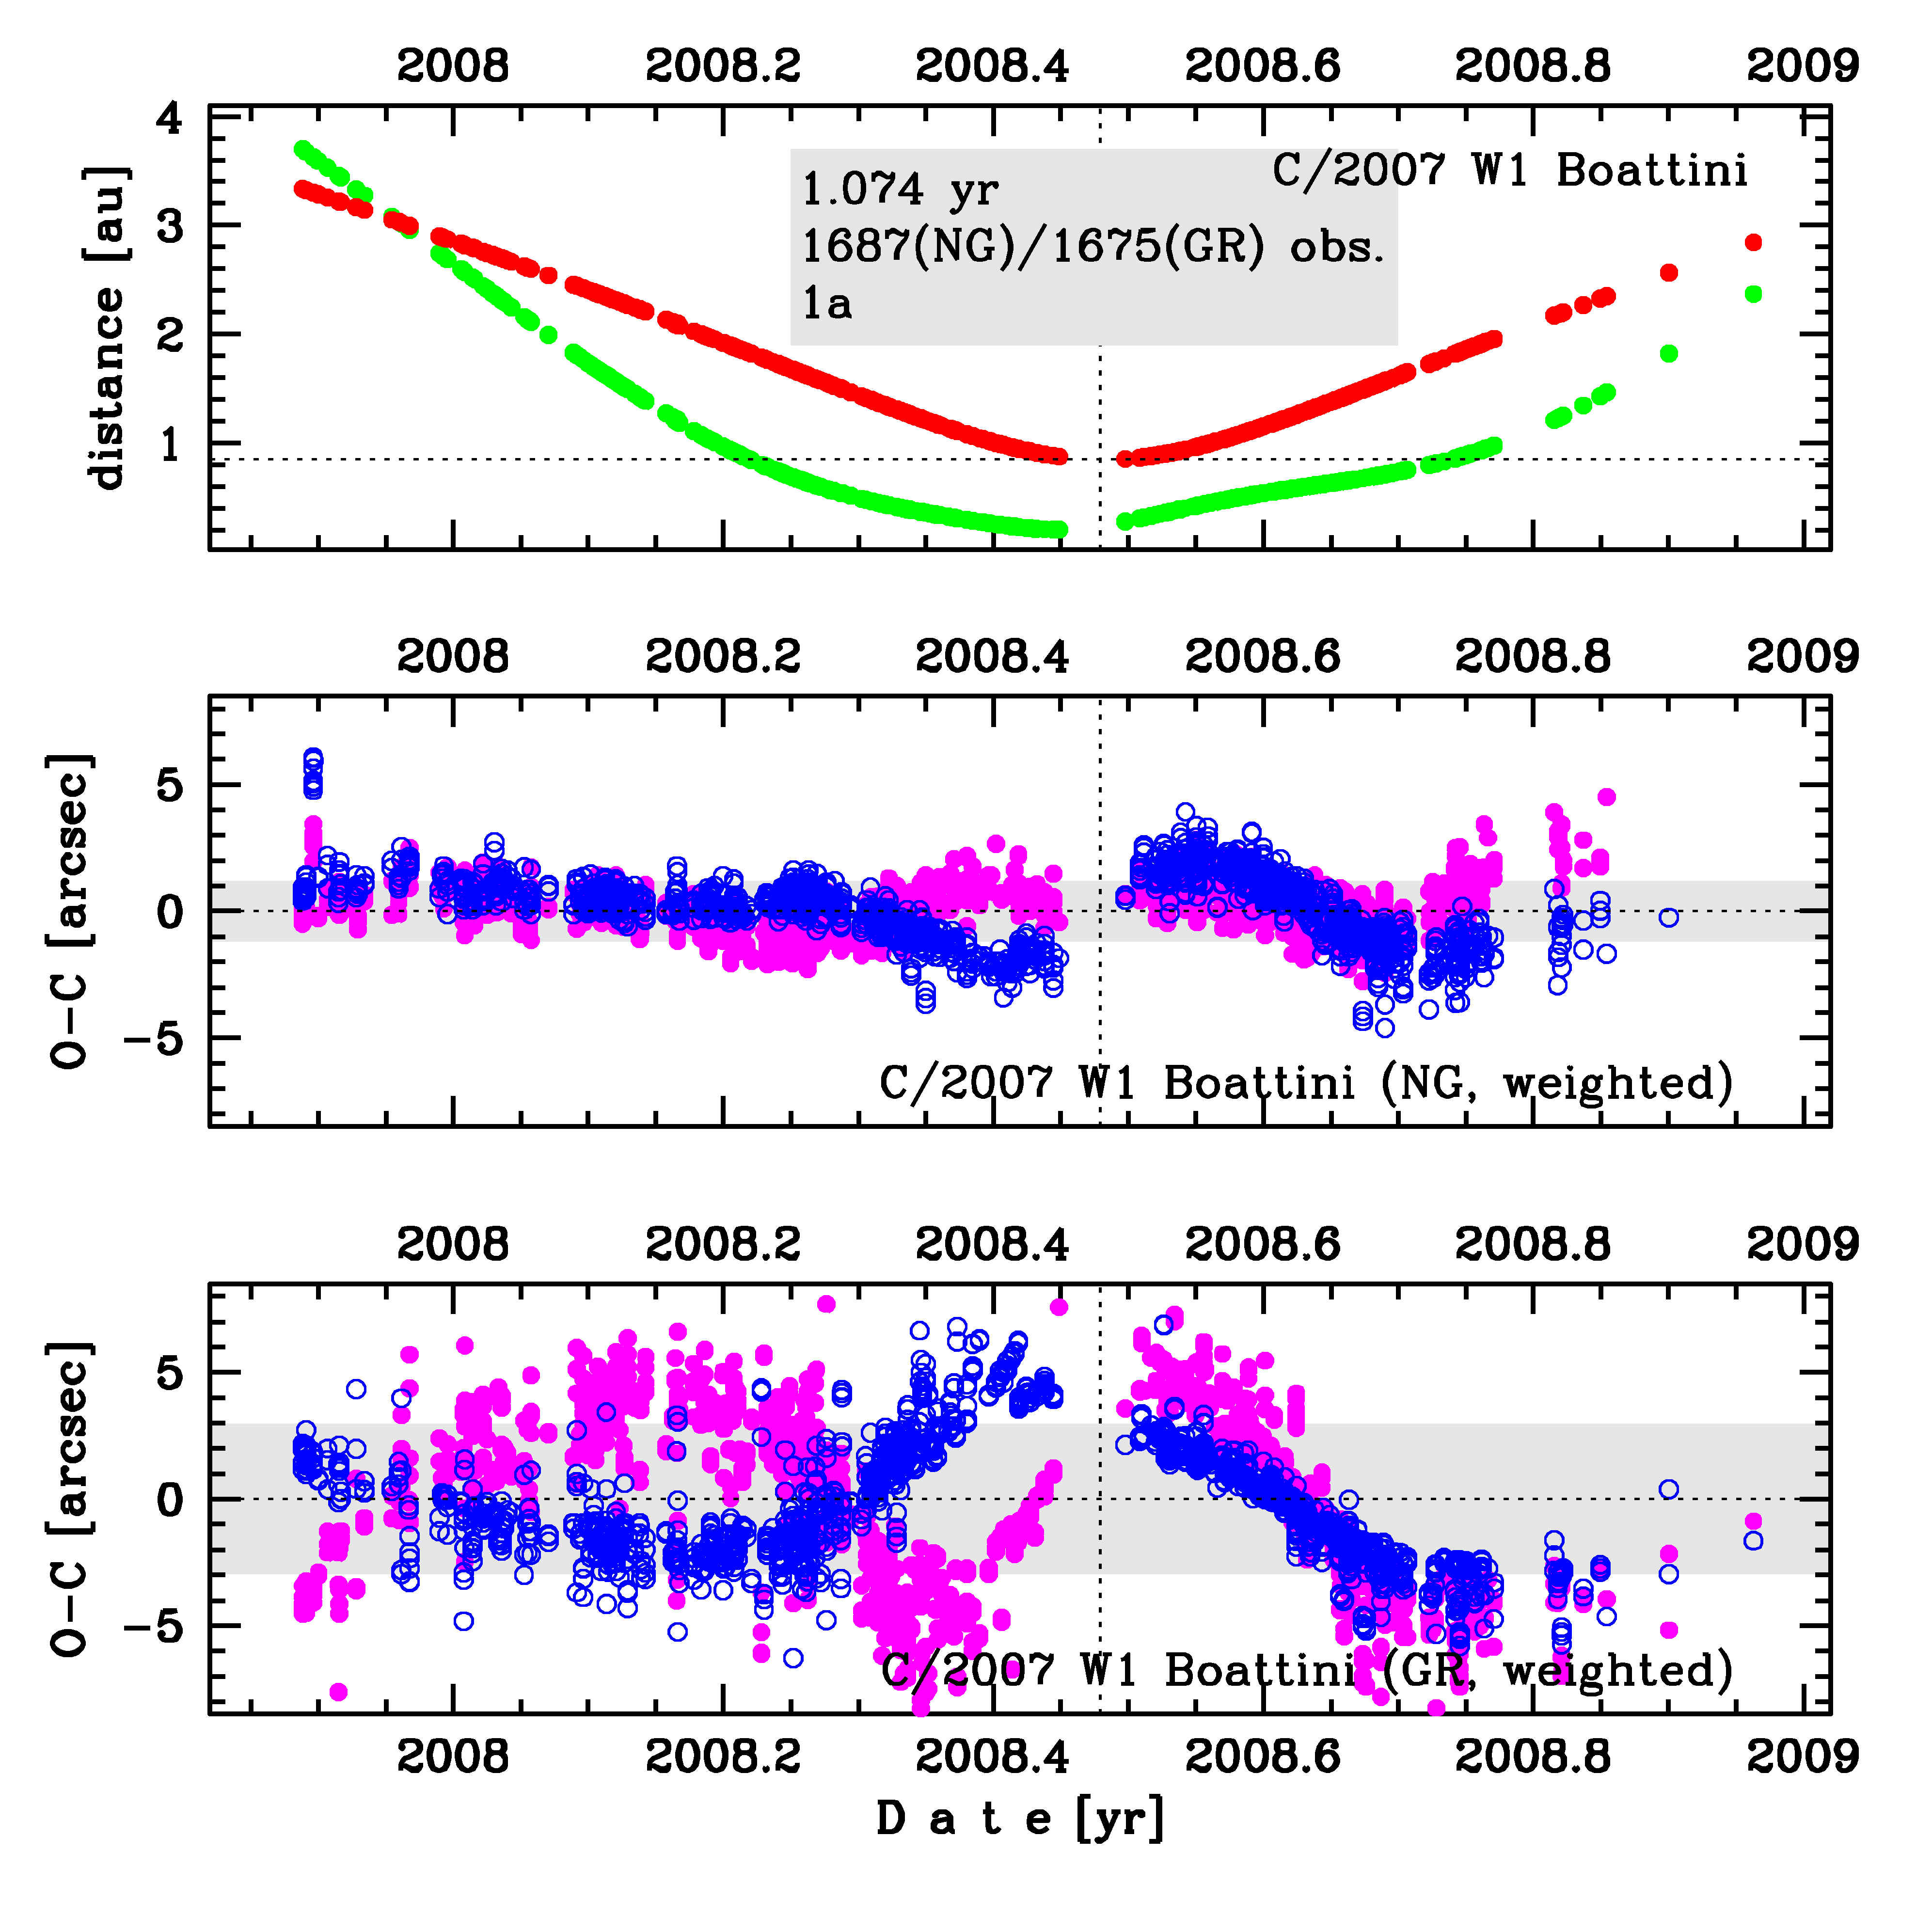
C/2007 W1 is a comet with non-gravitational effects strongly manifested in positional data fitting.
Orbits without pre-discovery data (seven first solutions).
For this comet, a considerable decrease in RMS for the symmetric non-gravitational solution compared with purely gravitational solution was observed, as well as a clear improvement in the amplitude of tendencies in right ascension and declination (compare nn with a5 solutions). A further substantial decrease in RMS occurs when an asymmetrical NG model is used to determine the orbit (n6).This last solution was recomended here as preferred global orbital solution; this solution is based on data spanning over 1.07 yr in a range of heliocentric distances: 3.33 au – 0.850 au (perihelion) – 2.84 au. However, for backward and forward dynamical evolution two separate orbital solutions are given: NG orbit for pre-perihelion arc of data dedicated for past orbital evolution, whereas NG orbit based on post-perihelion data is dedicated to future evolution.The NG parameters for both these NG solutions reveal that on average, the magnitude of NG acceleration obtained using positional data seems to be considerably greater after perihelion than before perihelion. A similar approach was applied earlier by Nakano for C/2007 W1; see Nakano Notes 1731Band Nakano Notes 1731A.
C/2007 W1 having a negative value of 1/aori for all types of solutions is an candidate to be an interstellar comet and suffers moderate planetary perturbations during its passage through the planetary system and these perturbations lead to more tight future orbit (see future barycentric orbits).
See also Królikowska and Dybczyński 2013 and Królikowska 2020.
Updated in September 2023 – In the Minor Planet Center are given 3 prediscovery measurements from 21 March 2007 – they were included in three last orbital solutions ('bt', 'qn', 'd5').
Currently, solution 'bt' was chosen as the preferred solution based on almost entire data-arc; however, solution 'd5' based on a part of pre-perihelion data is recommended to use for studying the origin of this comet. Using this last orbit, we obtained original 1/a which suggests that this comet was probable an Oort Cloud comet with extremaly large original semimamor axis.
| solution description | ||
|---|---|---|
| number of observations | 1675 | |
| data interval | 2007 11 20 – 2008 12 17 | |
| data type | perihelion within the observation arc (FULL) | |
| data arc selection | entire data set (STD) | |
| range of heliocentric distances | 3.33 au – 0.85 au (perihelion) – 2.84 au | |
| detectability of NG effects in the comet's motion | comet with NG effects strongly manifested in positional data fitting | |
| type of model of motion | GR - gravitational orbit | |
| data weighting | YES | |
| number of residuals | 3339 | |
| RMS [arcseconds] | 2.96 | |
| orbit quality class | 1a | |
| orbital elements (barycentric ecliptic J2000) | ||
|---|---|---|
| Epoch | 2311 04 17 | |
| perihelion date | 2008 06 24.79427665 | ± 0.00004779 |
| perihelion distance [au] | 0.84660004 | ± 0.00000049 |
| eccentricity | 0.99964232 | ± 0.00000275 |
| argument of perihelion [°] | 306.426725 | ± 0.000130 |
| ascending node [°] | 334.562364 | ± 0.000131 |
| inclination [°] | 9.894368 | ± 0.000039 |
| reciprocal semi-major axis [10-6 au-1] | 422.49 | ± 3.24 |
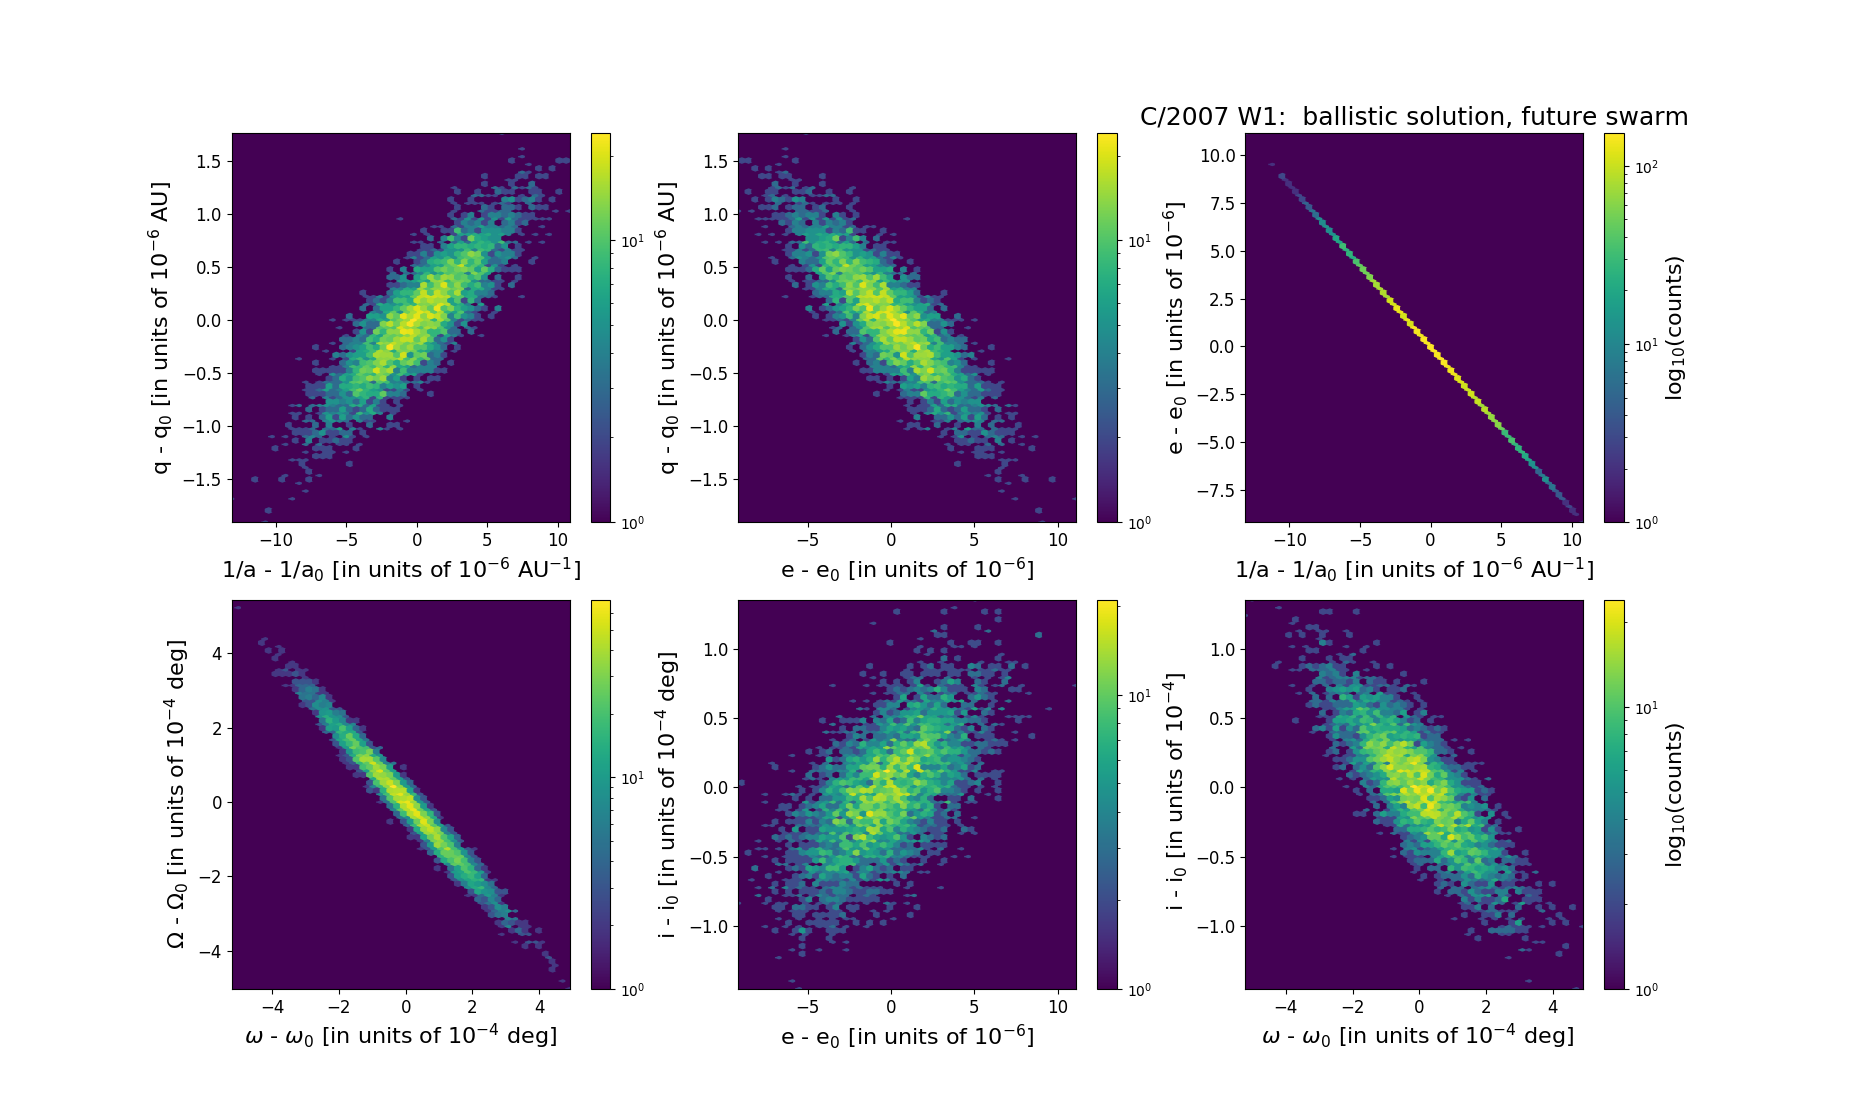
| file containing 5001 VCs swarm |
|---|
| 2007w1a5.bpl |

Upper panel: Time distribution of positional observations with corresponding heliocentric (red curve) and geocentric (green curve) distance at which they were taken. The horizontal dotted line shows the perihelion distance for a given comet whereas vertical dotted line — the moment of perihelion passage.
Lower panel (panels): O-C diagram for this(two) solution (solutions) given in this database, where residuals in right ascension are shown using magenta dots and in declination by blue open circles.
Lower panel (panels): O-C diagram for this(two) solution (solutions) given in this database, where residuals in right ascension are shown using magenta dots and in declination by blue open circles.
